- 方法一:DBMS_XPLAN.DISPLAY_CURSOR
- 方法二:explain plan for ......
- 方法三:Tuning SQL*Plus(autotrace)
- 方法四:+ gather_plan_statistics
- 方法五:10046
- 方法六: 10053
- 方法七:awrsqrpt.sql
- 方法八:statistics_level=all
方法一:DBMS_XPLAN.DISPLAY_CURSOR
(1)从共享池里获取
SELECT * FROM TABLE(dbms_xplan.display_cursor('SQL_ID'));
By default, the table function DISPLAY_CURSOR formats the execution plan for the last SQL statement executed by the session.
DISPLAY_CURSOR Function
This table function displays the explain plan of any cursor loaded in the cursor cache.
In addition to the explain plan, various plan statistics (such as. I/O, memory and timing) can be reported (based on the V$SQL_PLAN_STATISTICS_ALL VIEWS).
Syntax
DBMS_XPLAN.DISPLAY_CURSOR(
sql_id IN VARCHAR2 DEFAULT NULL,
cursor_child_no IN NUMBER DEFAULT 0,
format IN VARCHAR2 DEFAULT 'TYPICAL');
Example:
SYS@orcl> SELECT / TOTO / ename, dname FROM scott.dept d join scott.emp e USING (deptno);
14 rows selected.
SYS@orcl> SELECT sql_id, child_number FROM v$sql WHERE sql_text LIKE '%TOTO%';
--9dpnjdgna1k40
SYS@orcl> SELECT * FROM table(DBMS_XPLAN.DISPLAY_CURSOR('9dpnjdgna1k40',0));
SQL_ID 9dpnjdgna1k40, child number 0
SELECT / TOTO / ename, dname FROM scott.dept d join scott.emp e
USING (deptno)
Plan hash value: 844388907

----------------------------------------------------------------------------------------
| Id | Operation          | Name  | Rows | Bytes | Cost (%CPU)| Time   |
----------------------------------------------------------------------------------------
|  0 | SELECT STATEMENT       |     |    |    |   6 (100)|     |
|  1 | MERGE JOIN         |     |  14 |  308 |   6 (17)| 00:00:01 |
|  2 |  TABLE ACCESS BY INDEX ROWID| DEPT  |   4 |  52 |   2  (0)| 00:00:01 |
|  3 |  INDEX FULL SCAN      | PK_DEPT |   4 |    |   1  (0)| 00:00:01 |
|* 4 |  SORT JOIN         |     |  14 |  126 |   4 (25)| 00:00:01 |
|  5 |  TABLE ACCESS FULL     | EMP   |  14 |  126 |   3  (0)| 00:00:01 |
----------------------------------------------------------------------------------------

Predicate Information (identified by operation id):
---------------------------------------------------

4 - access("D"."DEPTNO"="E"."DEPTNO")
filter("D"."DEPTNO"="E"."DEPTNO")

24 rows selected.
或者直接查询:
SELECT t.* FROM v$sql s, table(DBMS_XPLAN.DISPLAY_CURSOR(s.sql_id, s.child_number)) t WHERE sql_text LIKE '%TOTO%';
优点:
(1)知道sql_id就可以得到执行计划,和explain plan for一样无须执行;
(2)可以得到真实执行计划;
缺点:
(1)没有输出运行时的相关统计信息(例如:逻辑读,递归调用次数,物理读等)
(2)无法判断处理多少上;
(3)无法判断表访问多少次;
适用:
一个SQL对应多个执行计划;
方法二: explain plan for获取
(1)EXPLAIN PLAN FOR XXX;
(2)select * from table(DBMS_XPLAN.DISPLAY);
(3)从awr性能视图里获取
SELECT * FROM TABLE(dbms_xplan.display_awr('SQL_ID'));
DISPLAY Function
This table function displays the contents of the plan table.
In addition, you can use this table function to display any plan (with or without statistics) stored in a table as long as the columns of this table are named the same as columns of the plan table (or V$SQL_PLAN_STATISTICS_ALL if statistics are included).
You can apply a predicate on the specified table to select rows of the plan to display.
Syntax
DBMS_XPLAN.DISPLAY(
table_name IN VARCHAR2 DEFAULT 'PLAN_TABLE',
statement_id IN VARCHAR2 DEFAULT NULL,
format IN VARCHAR2 DEFAULT 'TYPICAL',
filter_preds IN VARCHAR2 DEFAULT NULL);
Example:
(1)EXPLAIN PLAN FOR XXX;
(2)select * from table(DBMS_XPLAN.DISPLAY);
SYS@orcl>
EXPLAIN PLAN FOR
SELECT *
FROM scott.emp e, scott.dept d
WHERE e.deptno = d.deptno
AND e.ename = 'CLARK';
Explained.
SYS@orcl> SET LINESIZE 130
SYS@orcl> SET PAGESIZE 0
SYS@orcl> **SELECT * FROM table(DBMS_XPLAN.DISPLAY);**
Plan hash value: 3625962092

----------------------------------------------------------------------------------------
| Id | Operation          | Name  | Rows | Bytes | Cost (%CPU)| Time   |
----------------------------------------------------------------------------------------
|  0 | SELECT STATEMENT       |     |   1 |  58 |   4  (0)| 00:00:01 |
|  1 | NESTED LOOPS        |     |    |    |      |     |
|  2 |  NESTED LOOPS        |     |   1 |  58 |   4  (0)| 00:00:01 |
|* 3 |  TABLE ACCESS FULL     | EMP   |   1 |  38 |   3  (0)| 00:00:01 |
|* 4 |  INDEX UNIQUE SCAN     | PK_DEPT |   1 |    |   0  (0)| 00:00:01 |
|  5 |  TABLE ACCESS BY INDEX ROWID| DEPT  |   1 |  20 |   1  (0)| 00:00:01 |
----------------------------------------------------------------------------------------

Predicate Information (identified by operation id):
---------------------------------------------------

3 - filter("E"."ENAME"='CLARK')
4 - access("E"."DEPTNO"="D"."DEPTNO")

18 rows selected.
---如果执行计划下方出现'PLAN_TABLE' is old version提示,需要重新生成plan_table;
SQL> drop table PLAN_TABLE;
SQL> @?/rdbms/admin/utlxplan.sql
优点:
(1)无需真正的执行,快捷方便;
缺点:
(1)没有输出运行时的相关统计信息
(产生多少逻辑读,多少次递归调用,多少次物理读等情况)
(2)无法判断处理多少行;
(3)无法判断表被访问多少次;
适用于:
SQL执行很长时间才出结果或返回不了结果;
方法三:Tuning SQL*Plus(autotrace)
Tracing Statements
You can automatically get a report on the execution path used by the SQL optimizer and the statement execution statistics. The report is generated after successful SQL DML (that is, SELECT, DELETE, UPDATE and INSERT) statements. It is useful for monitoring and tuning the performance of these statements.
SQL*Plus report output may differ for DML if dynamic sampling is in effect.
Controlling the Autotrace Report
You can control the report by setting the AUTOTRACE system variable.
(1)SET AUTOTRACE OFF:
No AUTOTRACE report is generated. This is the default.
(2)SET AUTOTRACE ON EXPLAIN:
The AUTOTRACE report shows only the optimizer execution path
(3)SET AUTOTRACE ON STATISTICS:
The AUTOTRACE report shows only the SQL statement execution statistics.
(4)SET AUTOTRACE ON:
The AUTOTRACE report includes both the optimizer execution path and the SQL statement execution statistics.
(5)SET AUTOTRACE TRACEONLY:
Like SET AUTOTRACE ON, but suppresses the printing of the user's query output, if any.
If STATISTICS is enabled, query data is still fetched, but not printed.
To use this feature, you must create a PLAN_TABLE table in your schema and then have the PLUSTRACE role granted to you.
DBA privileges are required to grant the PLUSTRACE role.
(1)Creating a PLAN_TABLE
CONNECT HR
@$ORACLE_HOME/rdbms/admin/utlxplan.sql
(2)Creating the PLUSTRACE Role
CONNECT / AS SYSDBA
@$ORACLE_HOME/sqlplus/admin/plustrce.sql
(3)Granting the PLUSTRACE Role
CONNECT / AS SYSDBA
GRANT PLUSTRACE TO HR;
Example:
SYS@orcl> set autotrace on
SYS@orcl>
SELECT / TOTO / ename, dname FROM scott.dept d join scott.emp e USING (deptno);
......
14 rows selected.
Execution Plan
----------------------------------------------------------
Plan hash value: 844388907

----------------------------------------------------------------------------------------
| Id | Operation          | Name  | Rows | Bytes | Cost (%CPU)| Time   |
----------------------------------------------------------------------------------------
|  0 | SELECT STATEMENT       |     |  14 |  308 |   6 (17)| 00:00:01 |
|  1 | MERGE JOIN         |     |  14 |  308 |   6 (17)| 00:00:01 |
|  2 |  TABLE ACCESS BY INDEX ROWID| DEPT  |   4 |  52 |   2  (0)| 00:00:01 |
|  3 |  INDEX FULL SCAN      | PK_DEPT |   4 |    |   1  (0)| 00:00:01 |
|* 4 |  SORT JOIN         |     |  14 |  126 |   4 (25)| 00:00:01 |
|  5 |  TABLE ACCESS FULL     | EMP   |  14 |  126 |   3  (0)| 00:00:01 |
----------------------------------------------------------------------------------------

Predicate Information (identified by operation id):
---------------------------------------------------

4 - access("D"."DEPTNO"="E"."DEPTNO")
filter("D"."DEPTNO"="E"."DEPTNO")


Statistics
----------------------------------------------------------
0 recursive calls
0 db block gets
7 consistent gets
0 physical reads
0 redo size
819 bytes sent via SQL*Net to client
524 bytes received via SQL*Net from client
2 SQL*Net roundtrips to/from client
1 sorts (memory)
0 sorts (disk)
14 rows processed
报错SP2-0618需要执行plustrce.sql
SQL> conn scott/tiger
SQL> set autotrace on
SP2-0618: Cannot find the Session Identifier. Check PLUSTRACE role is enabled
SP2-0611: Error enabling STATISTICS report
SQL> @?/sqlplus/admin/plustrce.sql
SQL> grant plustrace to scott;
优点:
(1)可以输出运行时的相关统计信息(产生多少逻辑读,多少次递归调用,多少次物理读)
(2)traceonly可以控制返回结果不输出;
缺点:
(1)必须等到语句真正执行完毕后,才可以出结果;
(2)无法看到表被访问多少次;
方法四:+ gather_plan_statistics
SYS@orcl> set linesize 130
SYS@orcl> show parameter statistics_level
NAME TYPE VALUE
statistics_level string TYPICAL
SYS@orcl> SELECT /+ gather_plan_statistics /
ename, dname
FROM scott.dept d
join scott.emp e
USING (deptno);
......
14 rows selected.
SYS@orcl> **select * from table(dbms_xplan.display_cursor(null,null,'allstats last'));**

PLAN_TABLE_OUTPUT
----------------------------------------------------------------------------------------------------------------------------------
SQL_ID 4y8f4mhhn471d, child number 0
-------------------------------------
SELECT /*+ gather_plan_statistics */ ename, dname  FROM scott.dept d
join scott.emp e USING (deptno)

Plan hash value: 844388907

-----------------------------------------------------------------------------------------------------------------------------
| Id | Operation          | Name  | Starts | E-Rows | A-Rows |  A-Time  | Buffers | OMem | 1Mem | Used-Mem |
-----------------------------------------------------------------------------------------------------------------------------
|  0 | SELECT STATEMENT       |     |   1 |    |   14 |00:00:00.01 |    7 |    |    |     |


PLAN_TABLE_OUTPUT
----------------------------------------------------------------------------------------------------------------------------------
|  1 | MERGE JOIN         |     |   1 |   14 |   14 |00:00:00.01 |    7 |    |    |     |
|  2 |  TABLE ACCESS BY INDEX ROWID| DEPT  |   1 |   4 |   4 |00:00:00.01 |    4 |    |    |     |
|  3 |  INDEX FULL SCAN      | PK_DEPT |   1 |   4 |   4 |00:00:00.01 |    2 |    |    |     |
|* 4 |  SORT JOIN         |     |   4 |   14 |   14 |00:00:00.01 |    3 | 2048 | 2048 | 2048 (0)|
|  5 |  TABLE ACCESS FULL     | EMP   |   1 |   14 |   14 |00:00:00.01 |    3 |    |    |     |
-----------------------------------------------------------------------------------------------------------------------------

Predicate Information (identified by operation id):
---------------------------------------------------

4 - access("D"."DEPTNO"="E"."DEPTNO")


PLAN_TABLE_OUTPUT
----------------------------------------------------------------------------------------------------------------------------------
filter("D"."DEPTNO"="E"."DEPTNO")

24 rows selected.
(1)starts为该SQL执行的次数;
(2)E -Rows为执行计划预计的行数;
(3)A-Rows为实际返回的行数。A-Rows和E-Rows做比较,就可以确定哪一步执行计划出了问题。
(4)A-Time为每一步实际执行的时间(HH:MM:SS.FF),根据这一行可以知道该SQL耗时在哪个地方;
(5)buffers为每一步实际执行的逻辑读或一致性读;
(6)Reads为物理读;
优点:
(1)可以清晰的从STARTS得出表被访问多少次;
(2)可以清晰的从E-ROWS和A-ROWS中得到预测的行数和真实的行数,从而可以准确判断Oracle评估是否准确;
(3)BUFFER显示真实的逻辑读数量;
缺点:
(1)必须要等到语句真正执行完毕后,才能出结果;
(2)无法控制记录不打屏输出,没有类似autotrace的traceonly的功能;
(3)看不出递归调用的次数,看不出物理读;
适用:
获取表被访问的次数;
方法五:10046
(1)
设置追踪标识符
alter session set tracefile_identifier='10046';
开启跟踪
alter session set events '10046 trace name context forever, level 12';
执行语句
select count(*) from all_objects;
关闭10046追踪
alter session set events '10046 trace name context off';
(2)
oradebug setmypid;
oradebug unlimit;
oradebug event 10046 trace name context forever ,level 12;
SELECT ename, dname FROM scott.dept d join scott.emp e USING (deptno);
oradebug tracefile_name;
Oradebug event 10046 trace name context off;
Example 1:
SYS@orcl> alter session set tracefile_identifier='10046';
SYS@orcl> alter session set events '10046 trace name context forever, level 12';
SYS@orcl> SELECT ename, dname FROM scott.dept d join scott.emp e USING (deptno);
SYS@orcl> alter session set events '10046 trace name context off';
[oracle@uf2010813 trace]$ pwd
/opt/oracle/app/diag/rdbms/orcl/orcl/trace
[oracle@uf2010813 trace]$ ll -rth 10046
-rw-r-----. 1 oracle oinstall 135 Jul 31 21:55 orcl_ora_29418_10046.trm
-rw-r-----. 1 oracle oinstall 3.8K Jul 31 21:55 orcl_ora_29418_10046.trc
[oracle@uf2010813 trace]$ tkprof orcl_ora_29418_10046.trc 10046.log sys=no
Example 2:
SYS@orcl> oradebug setmypid;
SYS@orcl> oradebug unlimit;
SYS@orcl> oradebug event 10046 trace name context forever ,level 12;
SYS@orcl> SELECT ename, dname FROM scott.dept d join scott.emp e USING (deptno);
SYS@orcl> oradebug tracefile_name;
/opt/oracle/app/diag/rdbms/orcl/orcl/trace/orcl_ora_31388.trc
SYS@orcl> Oradebug event 10046 trace name context off;
[oracle@uf2010813 trace]$ tkprof orcl_ora_31388.trc 10046.log1 sys=no
Elapsed times include waiting on following events:
Event waited on Times Max. Wait Total Waited
---------------------------------------- Waited ---------- ------------
SQL*Net message to client 4 0.00 0.00
SQL*Net message from client 4 6.17 17.25
Disk file operations I/O 2 0.00 0.00
db file sequential read 4 0.02 0.04
Elapsed times include waiting on following events:
Event waited on Times Max. Wait Total Waited
---------------------------------------- Waited ---------- ------------
Disk file operations I/O 1 0.00 0.00
db file sequential read 23 0.01 0.12
asynch descriptor resize 1 0.00 0.00
1 user SQL statements in session.
66 internal SQL statements in session.
67 SQL statements in session.
Trace file: orcl_ora_31388.trc
Trace file compatibility: 11.1.0.7
Sort options: default
1 session in tracefile.
1 user SQL statements in trace file.
66 internal SQL statements in trace file.
67 SQL statements in trace file.
13 unique SQL statements in trace file.
1390 lines in trace file.
0 elapsed seconds in trace file.
优点:
(1)可以看出SQL语句对应的等待事件;
(2)如果SQL语句中有函数调用,函数中又有SQL,将会被列出;
(3)可以方便的看出处理的行数,产生的物理读,逻辑读;
(4)可以方便的看出解析时间和执行计划;
(5)可以跟踪整个程序包;
缺点:
(1)步骤繁琐;
(2)无法判断表被访问多少次;
(3)执行计划中谓词部分不能清晰展现出来;
适用:如果SQL中含函数,函数中又套SQL等,即存在多层调用,想准确分析只能用方法;
方法六:10053
(1)
alter session set tracefile_identifier='10053';
ALTER SESSION SET EVENTS='10053 trace name context forever, level 1';
select count(*) from dba_users;
ALTER SESSION SET EVENTS '10053 trace name context off';
(2)
oradebug setmypid;
oradebug unlimit;
oradebug event 10053 trace name context forever, level 1;
SELECT ename, dname FROM scott.dept d join scott.emp e USING (deptno);
oradebug tracefile_name;
Oradebug event 10053 trace name context off;
Example 1:
SYS@orcl> alter session set tracefile_identifier='10053';
SYS@orcl> ALTER SESSION SET EVENTS='10053 trace name context forever, level 1';
SYS@orcl> select count(*) from dba_users;
SYS@orcl> ALTER SESSION SET EVENTS '10053 trace name context off';
[oracle@uf2010813 trace]$ ls -l 10053
-rw-r-----. 1 oracle oinstall 566260 Aug 1 00:27 orcl_ora_13125_10053.trc
-rw-r-----. 1 oracle oinstall 119517 Aug 1 00:27 orcl_ora_13125_10053.trm
Example 2:
SYS@orcl> oradebug setmypid;
SYS@orcl> oradebug unlimit;
SYS@orcl> oradebug event 10053 trace name context forever, level 1;
SYS@orcl> SELECT ename, dname FROM scott.dept d join scott.emp e USING (deptno);
SYS@orcl> oradebug tracefile_name;
/opt/oracle/app/diag/rdbms/orcl/orcl/trace/orcl_ora_11907_10053.trc
SYS@orcl> Oradebug event 10053 trace name context off;
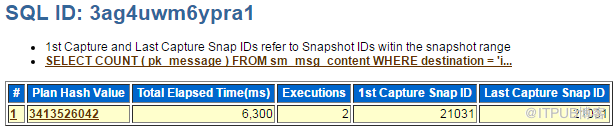
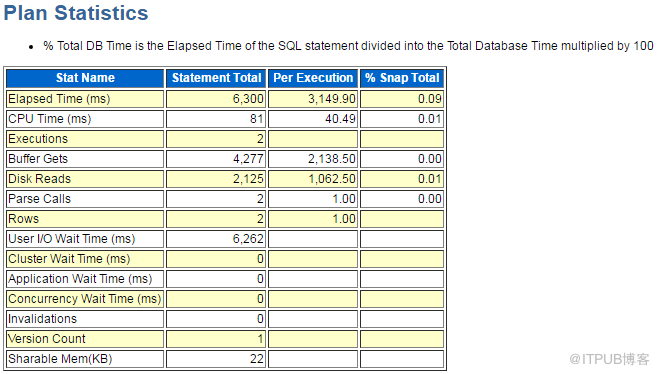
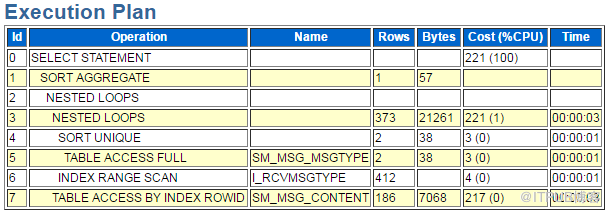
方法七: awrsqrpt.sql
(1)@?/rdbms/admin/awrsqrpt.sql
Type Specified: html
Enter value for num_days: 1
Enter value for begin_snap: 21034
Enter value for end_snap: 21035
Enter value for sql_id: 3ag4uwm6ypra1
Enter value for report_name: awrsqlrpt_0731.html
[oracle@uf2010813 ~]$ ls -l awrsqlrpt_0731.html
-rw-r--r--. 1 oracle oinstall 13773 Aug 1 03:03 awrsqlrpt_0731.html
---Exec dbms_workload_repository.create_snapshot;
方法八: statistics_level=all
(1)alter session set statistics_level=all;
(2)执行SQL;
(3)查看执行计划;
select * from table(dbms_xplan.display_cursor(null,null,'allstats last'));
Example:
**SYS@orcl>**  **show parameter statistics_level**
**NAME                 TYPE    VALUE**
**------------------------------------ ----------- ------------------------------**
**statistics_level           string   TYPICAL**

**SYS@orcl> alter session set statistics_level=all;**

**SYS@orcl> set linesize 130**
**SYS@orcl> SELECT /* TOTO */ ename, dname FROM scott.dept d join scott.emp e USING (deptno);**
**SYS@orcl> select * from table(dbms_xplan.display_cursor(null,null,'allstats last'));**

PLAN_TABLE_OUTPUT
----------------------------------------------------------------------------------------------------------------------------------
SQL_ID 72zuupmcd922s, child number 0
-------------------------------------
SELECT /* TOTO */ ename, dname  FROM scott.dept d  join scott.emp e
USING (deptno)

Plan hash value: 844388907

-----------------------------------------------------------------------------------------------------------------------------
| Id | Operation          | Name  | Starts | E-Rows | A-Rows |  A-Time  | Buffers | OMem | 1Mem | Used-Mem |
-----------------------------------------------------------------------------------------------------------------------------
|  0 | SELECT STATEMENT       |     |   1 |    |   14 |00:00:00.01 |    7 |    |    |     |

PLAN_TABLE_OUTPUT
----------------------------------------------------------------------------------------------------------------------------------
|  1 | MERGE JOIN         |     |   1 |   14 |   14 |00:00:00.01 |    7 |    |    |     |
|  2 |  TABLE ACCESS BY INDEX ROWID| DEPT  |   1 |   4 |   4 |00:00:00.01 |    4 |    |    |     |
|  3 |  INDEX FULL SCAN      | PK_DEPT |   1 |   4 |   4 |00:00:00.01 |    2 |    |    |     |
|* 4 |  SORT JOIN         |     |   4 |   14 |   14 |00:00:00.01 |    3 | 2048 | 2048 | 2048 (0)|
|  5 |  TABLE ACCESS FULL     | EMP   |   1 |   14 |   14 |00:00:00.01 |    3 |    |    |     |
-----------------------------------------------------------------------------------------------------------------------------

Predicate Information (identified by operation id):
---------------------------------------------------

4 - access("D"."DEPTNO"="E"."DEPTNO")

PLAN_TABLE_OUTPUT
----------------------------------------------------------------------------------------------------------------------------------
filter("D"."DEPTNO"="E"."DEPTNO")


24 rows selected.
参考至:《循规蹈矩:快速读懂SQL执行计划的套路与工具》---梁敬彬
更多信息见官方文档:
http://docs.oracle.com/cd/E11882_01/appdev.112/e40758/d_xplan.htm#ARPLS378
DBMS_XPLAN
The DBMS_XPLAN package provides an easy way to display the output of the EXPLAIN PLAN command in several, predefined formats. You can also use the DBMS_XPLAN package to display the plan of a statement stored in the Automatic Workload Repository (AWR) or stored in a SQL tuning set. It further provides a way to display the SQL execution plan and SQL execution runtime statistics for cached SQL cursors based on the information stored in the V$SQL_PLAN and V$SQL_PLAN_STATISTICS_ALL fixed views. Finally, it displays plans from a SQL plan baseline.
Overview
The DBMS_XPLAN package supplies five table functions:
DISPLAY - to format and display the contents of a plan table.
DISPLAY_AWR - to format and display the contents of the execution plan of a stored SQL statement in the AWR.
DISPLAY_CURSOR - to format and display the contents of the execution plan of any loaded cursor.
DISPLAY_SQL_PLAN_BASELINE - to display one or more execution plans for the SQL statement identified by SQL handle
DISPLAY_SQLSET - to format and display the contents of the execution plan of statements stored in a SQL tuning set.
Tuning SQL*Plus
SQL*Plus User's Guide and Reference
Statistics
The statistics are recorded by the server when your statement executes and indicate the system resources required to execute your statement. The results include the following statistics.
(1)recursive calls
Number of recursive calls generated at both the user and system level. Oracle Database maintains tables used for internal processing. When Oracle Database needs to make a change to these tables, it internally generates an internal SQL statement, which in turn generates a recursive call.
(2)db block gets
Number of times a CURRENT block was requested.
(3)consistent gets
Number of times a consistent read was requested for a block
(4)physical reads
Total number of data blocks read from disk. This number equals the value of "physical reads direct" plus all reads into buffer cache.
(5)redo size
Total amount of redo generated in bytes
(6)bytes sent through SQL*Net to client
Total number of bytes sent to the client from the foreground processes.
(7)bytes received through SQL*Net from client
Total number of bytes received from the client over Oracle Net.
(8)SQL*Net round-trips to/from client
Total number of Oracle Net messages sent to and received from the client
(9)sorts (memory)
Number of sort operations that were performed completely in memory and did not require any disk writes
(10)sorts (disk)
Number of sort operations that required at least one disk write
(11)rows processed
Number of rows processed during the operation
STATISTICS_LEVEL = { ALL | TYPICAL | BASIC }
STATISTICS_LEVEL specifies the level of collection for database and operating system statistics. The Oracle Database collects these statistics for a variety of purposes, including making self-management decisions.
The default setting of TYPICAL ensures collection of all major statistics required for database self-management functionality and provides best overall performance. The default value should be adequate for most environments.
When the STATISTICS_LEVEL parameter is set to ALL, additional statistics are added to the set of statistics collected with the TYPICAL setting. The additional statistics are timed OS statistics and plan execution statistics.
Setting the STATISTICS_LEVEL parameter to BASIC disables the collection of many of the important statistics required by Oracle Database features and functionality, including:
(1)Automatic Workload Repository (AWR) Snapshots
(2)Automatic Database Diagnostic Monitor (ADDM)
(3)All server-generated alerts
(4)Automatic SGA Memory Management
(5)Automatic optimizer statistics collection
(6)Object level statistics
(7)End to End Application Tracing (V$CLIENT_STATS)
(8)Database time distribution statistics (V$SESS_TIME_MODEL and V$SYS_TIME_MODEL)
(9)Service level statistics
(10)Buffer cache advisory
(11)MTTR advisory
(12)Shared pool sizing advisory
(13)Segment level statistics
(14)PGA Target advisory
(15)Timed statistics
(16)Monitoring of statistics
转载自chenoracle
